+
Data Collection Test Site Results
Since Solar Road Panels must be laid flat, unlike rooftop solar, we are collecting data at different latitudes to compare the difference in energy harvesting. We take regular store-bought solar panels and angle one to the south at the optimal angle for that latitude and place the other flat.
In April of 2015, a collection site was installed in southern Arizona at the Biosphere 2 in Oracle, Arizona. A second site was set up at Solar Roadways in Sagle, Idaho in August 2015. A third site was set up at the Missouri DOT Transportation Research Center in Chesterfield, Missouri in March 2016.
The Sagle, ID site uses 220W solar panels and the Oracle, AZ and Chesterfield, MO sites use 250W solar panels.
As can be seen from the data collected so far, the flat panels generate more energy than the tilted panels during overcast days. We believe this is because the photons are scattered on overcast days, and during such times, it is easier for them to land on a flat surface than one which is angled.
"Snow" indicates months where no data was collected because the panels were covered in snow and collected zero solar energy. Keep in mind that Solar Roadways will collect solar energy in every kind of weather as the panels will never be covered in snow thanks to our heating elements.
We are comparing the energy generated from solar panels laid flat (as they will be for Solar Roadways installations) vs energy generated from panels angled for each given latitude the way it's done for solar farms or rooftop panels. The data thus far is surpassing our expectations.
Each of these Data Collection Sites will soon receive a complimentary SR3 panel to diplay to thank them for their participation in this program. We are currently considering two more data collection sites: one below the 32 degrees N latitude and the other above the 49 degrees N latitude. They should be high visibility areas with an open southern exposure.
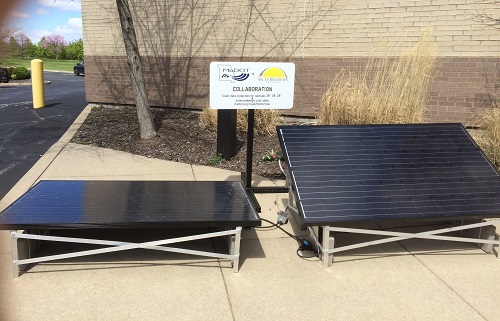 Test site at MoDOT
 | Location | Oracle, AZ | Chesterfield, MO | Sagle, ID | |||
|---|---|---|---|---|---|---|
| Latitude | 32⁰34’47.38” N | 38⁰38’27.81” N | 48⁰13’49.38” N | |||
| Micro-inverter # | 2452 (flat panel) | 2369 (angled panel) | 2276 (flat panel) | 1951 (angled panel) | 6270 (flat panel) | 6277 (angled panel) |
| 2015 May | 44.1 kWh | 44.1 kWh | - | - | - | - |
| 2015 Jun | 41.2 kWh | 39.9 kWh | - | - | - | - |
| 2015 Jul | 35.3 kWh | 34.4 kWh | - | - | - | - |
| 2015 Aug | 36.6 kWh | 37.8 kWh | - | - | - | - |
| 2015 Sep | 30.2 kWh | 34.3 kWh | - | - | 20.5 kWh | 26.0 kWh |
| 2015 Oct | 27.1 kWh | 33.8 kWh | - | - | 13.4 kWh | 20.6 kWh |
| 2015 Nov | 24.4 kWh | 35.5 kWh | - | - | snow | snow |
| 2015 Dec | 19.7 kWh | 29.7 kWh | - | - | snow | snow |
| 2016 Jan | 22.1 kWh | 32.3 kWh | - | - | snow | snow |
| 2016 Feb | 28.7 kWh | 39.3 kWh | - | - | snow | snow |
| 2016 Mar | 35.8 kWh | 43.8 kWh | 16.0 kWh | 17.8 kWh | 15.9 kWh | 18.8 kWh |
| 2016 Apr | 40.0 kWh | 42.9 kWh | 28.4 kWh | 26.4 kWh | 26.8 kWh | 30.3 kWh |
| 2016 May | 45.8 kWh | 47.1 kWh | 27.4 kWh | 17.9 kWh | 33.5 kWh | 30.7 kWh |
| 2016 Jun | 39.6 kWh | 38.8 kWh | 25.0 kWh | 17.4 kWh | 36.1 kWh | 31.0 kWh |
| 2016 Jul | 42.6 kWh | 41.6 kWh | 23.4 kWh | 16.6 kWh | 35.5 kWh | 32.7 kWh |
| 2016 Aug | 37.5 kWh | 39.3 kWh | 17.4 kWh | 23.8 kWh | - | - |
| 2016 Sep | 30.9 kWh | 34.6 kWh | 23.5 kWh | 21.0 kWh | - | - |
| 2016 Oct | 30.9 kWh | 39.5 kWh | 23.1 kWh | 16.9 kWh | - | - |
| 2016 Nov | 24.1 kWh | 34.4 kWh | 12.5 kWh | 21.0 kWh | 6.09 | 10.4 |
| 2016 Dec | 15.0 kWh | 23.0 kWh | 8.9 kWh | 16.2 kWh | snow | snow |
| 2017 Jan | - | - | 8.4 KWh | 12.5 kWh | snow | snow |
| 2017 Feb | 15.3 kWh | 21.4 KWh | 15.3 KWh | 21.4 kWh | snow | snow |
| 2017 Mar | 37.3 kWh | 44.2 KWh | 17.8 KWh | 22.4 kWh | Damaged by snow | No longer in service |
| 2017 Apr | 40.3 kWh | 43.7 KWh | 22.2 KWh | 21.8 kWh | ||
| 2017 May | 45.2 kWh | 45.0 KWh | 24.7 KWh | 17.4 kWh | ||
| 2017 Jun | 44.5 kWh | 43.2 KWh | 23.6 KWh | 16.3 kWh | ||
| 2017 Jul | 37.4 kWh | 35.7 KWh | 25.7 KWh | 17.8 kWh | ||
| 2017 Aug | 38.8 kWh | 40.3 KWh | 25.9 KWh | 18.6 kWh | ||
| 2017 Sep | 35.2 kWh | 40.1 KWh | 23.8 KWh | 21.1 kWh | ||
| 2017 Oct | 14.6 kWh | 18.4 KWh | 14.7 KWh | 19.4 kWh | ||
| 2017 Nov | 21.8 kWh | 32.4 KWh | 12.0 KWh | 21.1 kWh | ||
